
BITCOIN
BITCOIN CPI
VenturE Portfolio
Funds
market INSIGHTS
INVESTOR RELATIONS
ABOUT
Contact

June 18, 2025


The Puell Multiple shows whether Bitcoin miners are earning more or less than on average, which helps indicate the state of the market and can point to a possible BTC price trend reversal.
Unlike RSI (Relative Strength Index) or MACD (Moving Average Convergence/Divergence), which track traders' behavior, the Puell Multiple focuses on miners. It reveals when they’re more inclined to sell or hold BTC, potentially affecting price pressure.
The Puell Multiple has gotten attention recently as it has indicated trend reversals on multiple occasions. Read on to learn more about the Puell Multiple and how it works.
The Puell Multiple tracks how miners' earnings in USD deviate from the yearly average.
When earnings spike, miners are more inclined to sell BTC at these elevated prices. When the market and, subsequently, revenue fall, they might tap into their fiat reserves more, hoping to sell BTC when the price recovers.
Created by on-chain analyst David Puell, the Puell Multiple doesn’t measure sentiment; it tracks revenue flow.
As miners, alongside ETFs and other institutional investors, are significant holders of BTC, their profits might influence selling pressure.
Bitcoin miner revenue chart
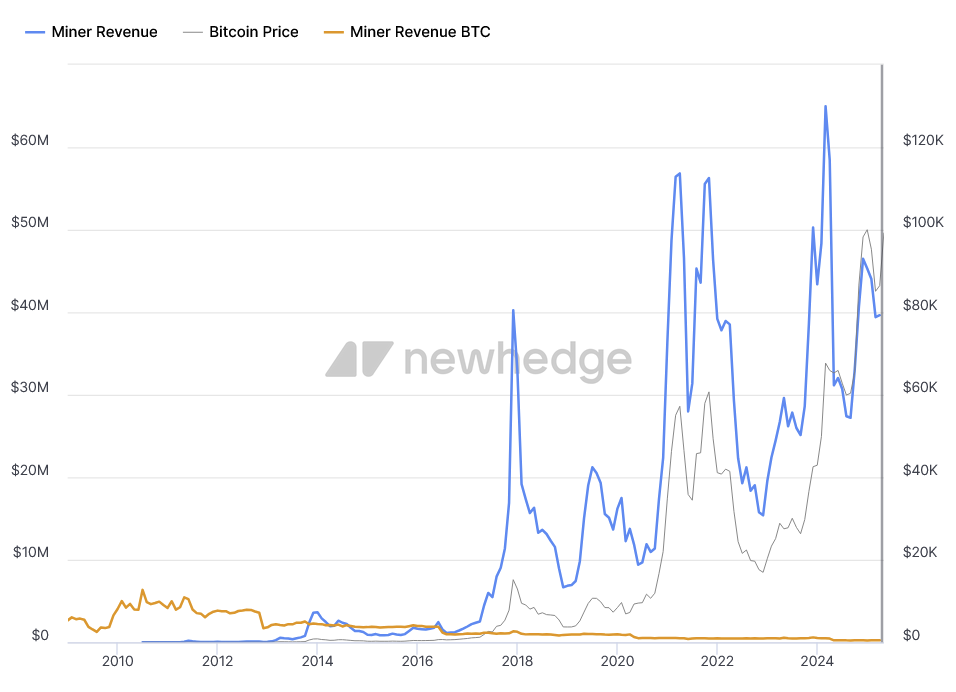
The Puell Multiple compares what miners earn today versus their average earnings over the past year in USD.
The formula is:
Puell Multiple = Daily BTC Issuance Value (USD) ÷ 365-day Moving Average of Daily Issuance Value (USD).
For example, if miners earned $10 million today and the yearly average is $2 million, the Puell Multiple would be 5. This suggests miner profits are sharply above the norm, which can encourage miners to sell more.
The logic is simple. Miners usually cover expenses by selling BTC. When revenue rises, they sell more. When it falls, they draw from reserves. In both cases, it can affect Bitcoin’s price.
Notably, the following chart shows the Puell Multiple divided into three zones over the past 15 years. Each is explained below.
Historical Puell Multiple, 2010 to 2025
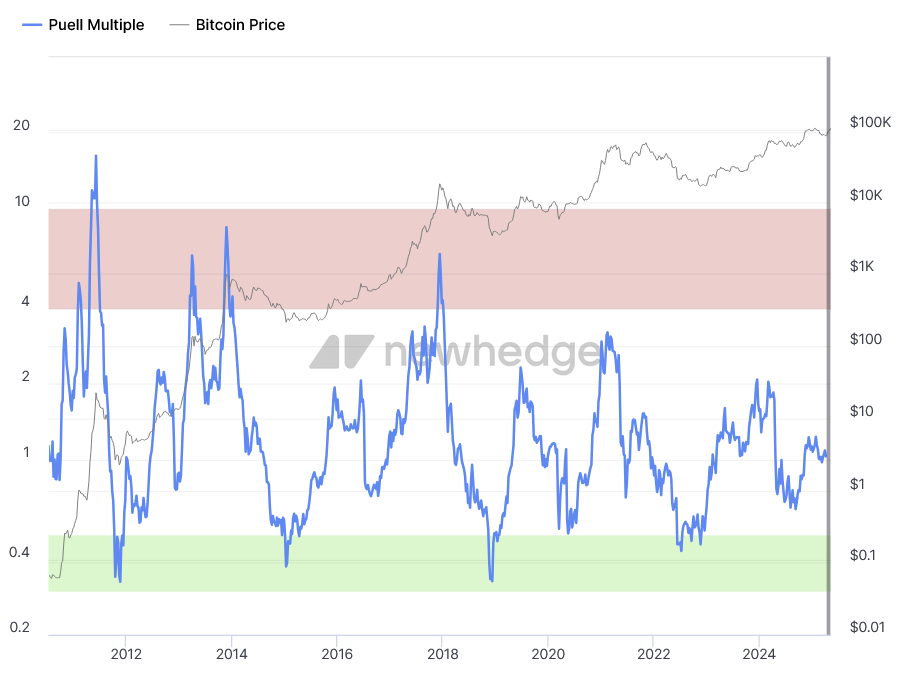
The Puell Multiple is interpreted as follows:
Some platforms use a downward-sloping line instead of a fixed red zone. This reflects Bitcoin halving events, which cut block rewards in half.
The last halving event, occurring in April 2024, reduced the reward from 6.25 to 3.125 BTC/block. As a result, the upper range of the Puell Multiple dropped.
Historically, the Puell Multiple has coincided with major BTC reversals ahead of time, especially during periods of overheating.
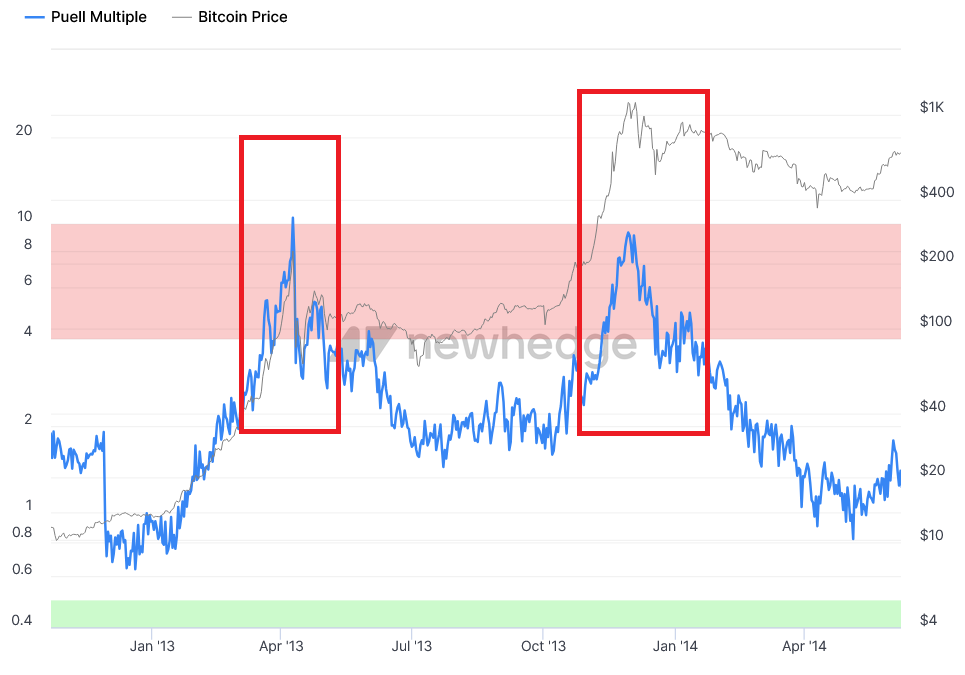
In 2013, the Puell Multiple broke above the red zone in April, reaching 10.48. One day later, BTC began to drop.
In early November of the same year, the Puell Multiple again rose above 9, entering the red zone. This occurred a week before Bitcoin peaked at $1,134. The indicator signaled overheating when the price was just above $300. After peaking at the end of November, both the price and the multiple began to decline in the following weeks.
Two cases of Puell Multiple and BTC price correlation in 2013
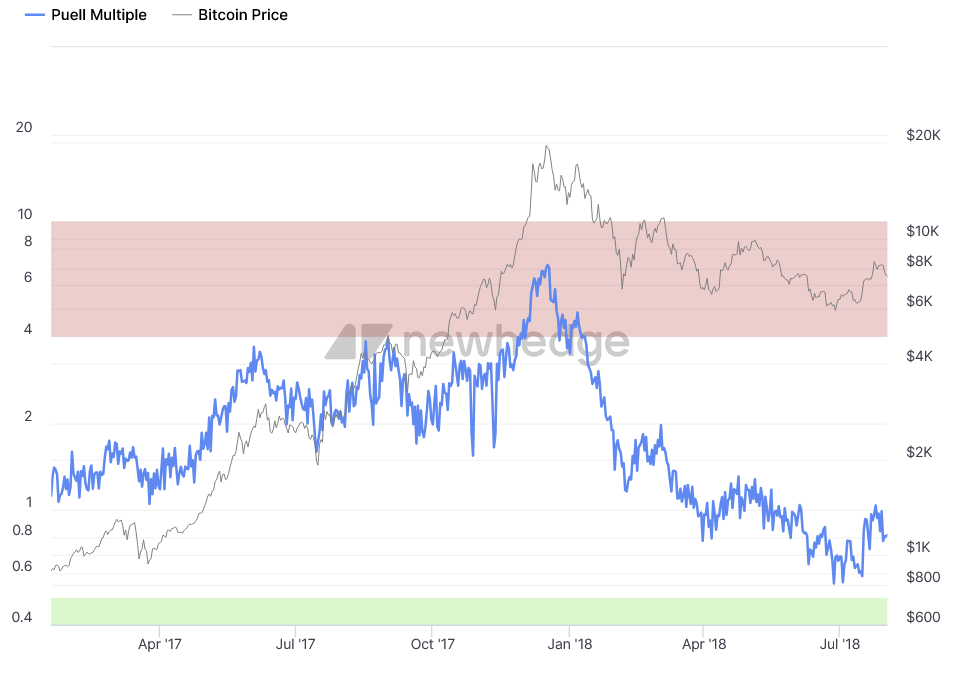
In 2017, the indicator pointed to profit-taking when bitcoin was near $11,000. Two weeks later, it hit an all-time high of around $19,000 before falling sharply.
Another case of Puell Multiple and BTC price correlation in 2017
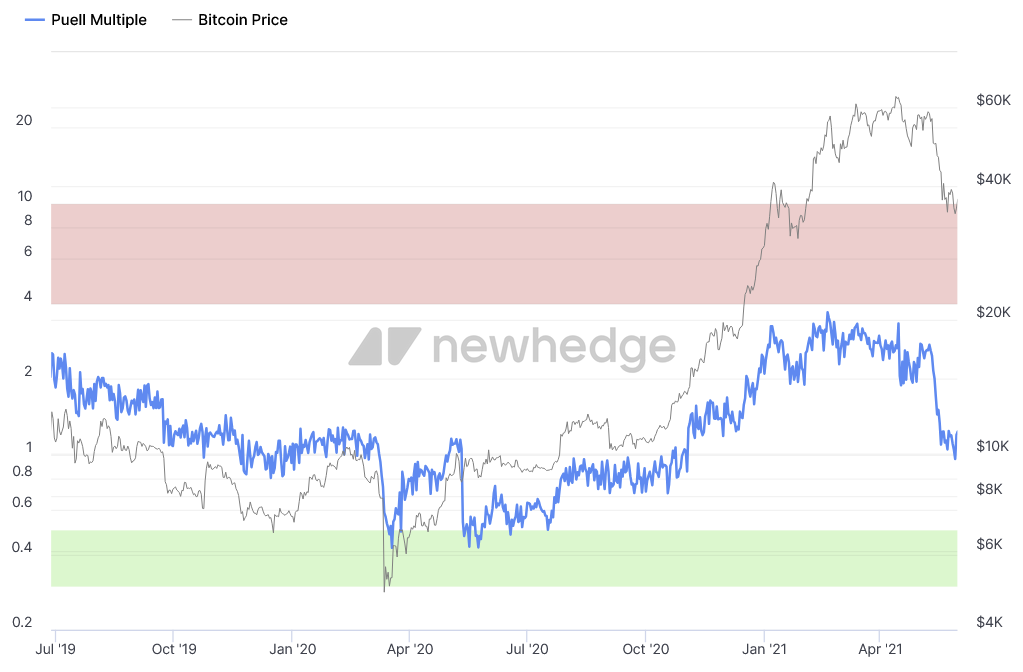
The Puell Multiple has proven reliable in the green zone as well. In 2011, 2015, 2018, and 2020, it fell below 0.5, correlating with periods of market panic and price bottoms.
The Puell Multiple marks the market bottom in 2020
It should be noted that the Puell Multiple is useful for position trading but not for intraday traders. On its own, it's unlikely to form the basis of a trading strategy. Only when combined with other tools, such as the Hash Ribbon indicator, can it potentially help to spot price trends.
Here is a summary of the benefits and limitations of the Puell Multiple.
The Puell Multiple is useful for identifying market overheating and periods of corrections. Additionally, it’s easy to read, making it accessible even for beginners.
Here’s what the Puell Multiple does:
The indicator won’t provide an exact entry point, but it helps identify the potential direction of the market.
Keep in mind that the Puell Multiple isn’t a comprehensive tool. It provides valuable insight, but not a full view of the market.
The limitations of the Puell Multiple include:
To use this indicator effectively, combine it with other tools and take into account the broader context.
The Puell Multiple compares miners' current daily profitability in USD to the annual average. It helps identify when the market is overheated or is near the bottom. However, it shouldn’t be used alone but in combination with other market indicators and tools.
On-chain trading analyst David Puell created the Puell Multiple to track how miners' behavior influences Bitcoin market cycles. Today, his indicator is used in trading analysis to identify shifts in long-term BTC trends. Additionally, Puell is the co-creator of the Market Value to Realized Value (MVRV) metric.

